Mercedes-Benz CLE-Class vs Toyota Corolla
2 head-to-heads across the 2026 and 2027 model years, side by side. At default weights the Corolla leads 2–0. Each verdict below is the one its own page prints — price, fuel, safety, space, performance, tech and warranty from EPA, NHTSA and manufacturer data — and the weights are yours to change on any of them.
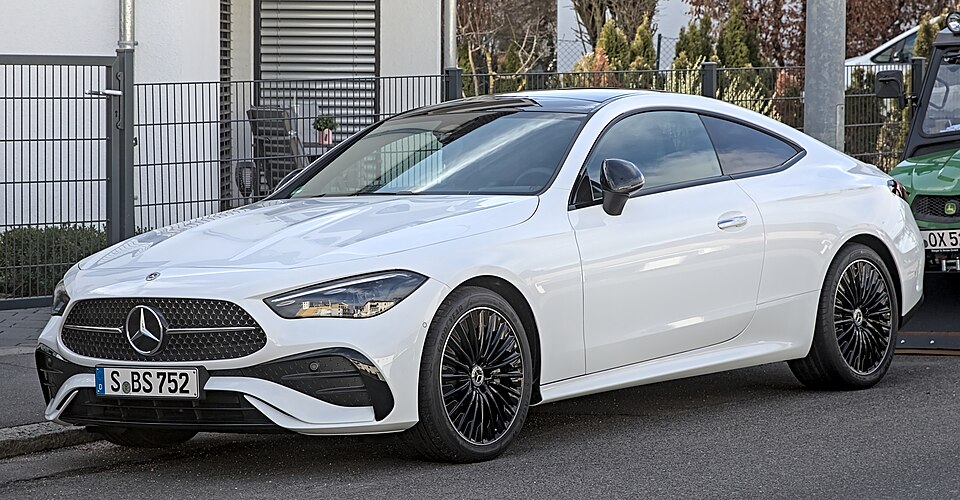

Year by year
2 head-to-heads · verdicts at default weightsClear win 6+ points · Edge 2–6 · Toss-up under 2
Across the years, category by category
2 scored head-to-headsThe CLE-Class leads on performance in 2 of 2; the Corolla on price in 1 of 1, fuel & range in 2 of 2, safety in 2 of 2. Category scores are 0–100 from the data on each pair page; a lead here means that model year scored higher in the category, whatever the weights.
| Category | CLE-Class leads | Corolla leads | Level |
|---|---|---|---|
| Price | 0 | 1 | 0 |
| Fuel & range | 0 | 2 | 0 |
| Safety | 0 | 2 | 0 |
| Space & cargo | 0 | 1 | 0 |
| Performance | 2 | 0 | 0 |
| Tech & comfort | 0 | 2 | 0 |
Common questions about the CLE-Class vs Corolla
Source: EPA, NHTSA and manufacturer press kitsWhich is better, the Mercedes-Benz CLE-Class or the Toyota Corolla?
In the newest scored pairing, the 2027 CLE-Class against the 2027 Corolla: The Toyota Corolla wins clearly, 95.5 to 58.9, on tech & comfort, fuel & range, safety. The Mercedes-Benz CLE-Class is ahead on performance. Across the 2 head-to-heads scored, the Corolla leads 2–0. Open the 2027 pair to change the weights.
Does the answer change from one model year to the next?
No. In every model year scored (2026 and 2027) the Corolla came out ahead at default weights.
Where is the biggest difference between the Mercedes-Benz CLE-Class and the Toyota Corolla?
The CLE-Class leads on performance in 2 of 2; the Corolla on price in 1 of 1, fuel & range in 2 of 2, safety in 2 of 2. Every count comes from the category scores on the pair pages linked above, which use EPA, NHTSA and manufacturer press-kit data.
How does WhichTrim decide which vehicle wins?
Each of seven categories — price, fuel and range, safety, space and cargo, performance, tech and comfort, warranty — is scored 0–100 from the data on the page. Relative measures give 100 to the better vehicle and a proportional share to the other; NHTSA stars and the Safety Signal use their own scales. The overall score is the weighted mean at the default weights (price 4, safety 4, fuel 3, tech 3, space 2, performance 2, warranty 2). A margin of 6 points or more is a clear win, 2 to 6 an edge, under 2 a toss-up. Every pair page has sliders to change the weights.